Logging Trace ID and Span ID in Spring Using Micrometer

When logging for debugging purposes, especially in distributed systems, it can be challenging to trace the flow of a transaction through logging.
In production environments, various parameters of a normal request or return information may be logged across different stages for debugging. A characteristic of such logs is that when multiple requests come in simultaneously, the logs may get intermingled, making it difficult to discern which log belongs to which request.
Moreover, it can be challenging to identify logs associated with a request when an error occurs.
In such scenarios, leveraging Trace ID and Span ID for logging can make it easier to differentiate and trace the flow of transactions through logs.
Prerequisite Knowledge
- This section does not cover logging libraries.
- For logging methods in Spring, adding JSON fields, or separating log formats for different environments, refer to the previous post “Using Logback in Spring Boot for Pattern and JSON Logging”.
- We will use Logback in this section, and the Logback configuration uses the
logback-spring.xmlfile.
Trace ID vs Span ID
Trace ID: An ID for tracing the entire transaction, maintained even among microservices.Span ID: An ID for tracing each unit within a transaction, maintained only within a microservice.
Micrometer
Micrometer is a library for collecting metrics to measure an application’s performance. Micrometer can be used with Spring Boot and Spring Cloud, and can integrate with various monitoring systems such as Zipkin, Prometheus, and Graphite.
Although it has a wide array of complex features, we will solely be using Micrometer’s functionality to assign a Trace ID and Span ID per request and utilize this for logging.
The method for conducting tracing with Zipkin will be covered in a future post.
Dependency Configuration
To use multiple tracing tools, more dependencies might be needed, but for using Trace ID and Span ID, adding the following two dependencies is sufficient:
dependencies {
    // micrometer
    implementation 'org.springframework.boot:spring-boot-starter-actuator'
    implementation 'io.micrometer:micrometer-tracing-bridge-brave'
}
Here, spring-boot-starter-actuator is a dependency for using Spring Boot Actuator, providing functionalities to monitor and manage the application’s operational behavior.
Logging Configuration
With just this configuration, you can add Trace ID and Span ID to the logs.
Micrometer adds Trace ID and Span ID to MDC, allowing us to utilize these with Logback to enhance our logs.
MDC stands for Mutable Diagnostic Context, enabling the addition of extra information to logs.
<?xml version="1.0" encoding="UTF-8"?>
<configuration scan="true" scanPeriod="30 seconds">

  <appender class="ch.qos.logback.core.ConsoleAppender" name="CONSOLE_JSON">
    <encoder class="ch.qos.logback.core.encoder.LayoutWrappingEncoder">
      <layout class="com.example.demo.common.log.TraceJsonLayout">
        <appendLineSeparator>true</appendLineSeparator>
        <jsonFormatter class="ch.qos.logback.contrib.jackson.JacksonJsonFormatter"/>
        <timestampFormat>yyyy-MM-dd'T'HH:mm:ss.SSS'Z'</timestampFormat>
        <timestampFormatTimezoneId>Etc/Utc</timestampFormatTimezoneId>
      </layout>
    </encoder>
  </appender>
  <appender class="ch.qos.logback.core.ConsoleAppender" name="CONSOLE_STDOUT">
    <encoder>
      <pattern>[%thread] %highlight([%-5level traceId=%X{traceId} spanId=%X{spanId}]) %cyan(%logger{15}) - %msg%n</pattern>
    </encoder>
  </appender>
  <springProfile name="qa, dev">
    <root level="INFO">
      <appender-ref ref="CONSOLE_JSON"/>
    </root>
  </springProfile>
  <springProfile name="local">
    <root level="INFO">
      <appender-ref ref="CONSOLE_STDOUT"/>
    </root>
  </springProfile>
</configuration>
Most of this configuration remains the same as in the previous post, with the key point being the addition of %X{traceId} and %X{spanId}. By incorporating %X{variableName}, variables in MDC can be added to the logs.
Additionally, the existing <layout class="com.example.demo.common.log.TraceJsonLayout"> overrides the toMap() method to add traceId and spanId from MDC, as shown below:
package com.example.demo.common.log;

import ch.qos.logback.classic.spi.ILoggingEvent;
import ch.qos.logback.contrib.json.classic.JsonLayout;
import java.util.Map;

public class TraceJsonLayout extends JsonLayout {

    @Override
    protected Map toJsonMap(ILoggingEvent event) {
        var map = super.toJsonMap(event);

        add("traceId", true, event.getMDCPropertyMap().get("traceId"), map);
        add("spanId", true, event.getMDCPropertyMap().get("spanId"), map);

        return map;
    }
}
Result
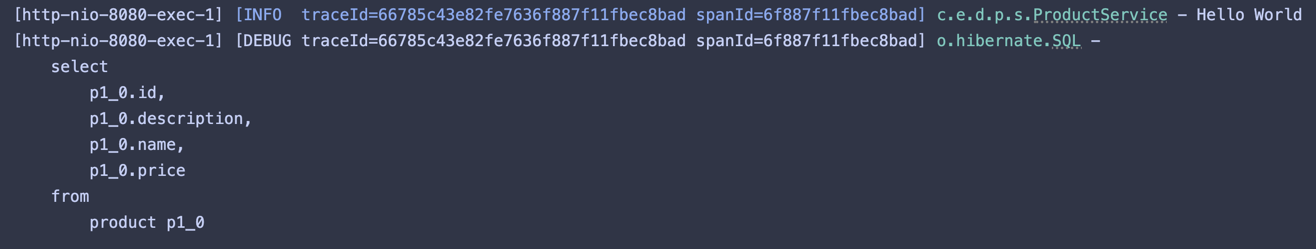
You can obtain logs as shown below:
JSON Log

Console Log